Using purrr::map() to identify available datasets in a list

purrr
Author

Cath Blatter

Published

November 28, 2019

What happened?

Recently I wanted to explore plotting R for the first time and discovered the ggswissmaps-package.

I’m new to the structure of geospatial data so I read the introductory vignette and followed the examples.

Examples from the ggswissmaps-package

#install.packages("ggswissmaps")

suppressPackageStartupMessages(library(ggswissmaps))
suppressPackageStartupMessages(library(tidyverse))

# Data frame with the coordinates of all swiss districts
d <- shp_df[["g1b15"]]

# Look at the structure of the data frame
glimpse(d)
Rows: 19,502
Columns: 21
$ long    <int> 679207, 680062, 679981, 680365, 680281, 680479, 680717, 681021…
$ lat     <int> 245176, 244294, 244051, 243411, 241866, 241584, 240695, 240306…
$ order   <int> 1, 2, 3, 4, 5, 6, 7, 8, 9, 10, 11, 12, 13, 14, 15, 16, 17, 18,…
$ hole    <lgl> FALSE, FALSE, FALSE, FALSE, FALSE, FALSE, FALSE, FALSE, FALSE,…
$ piece   <fct> 1, 1, 1, 1, 1, 1, 1, 1, 1, 1, 1, 1, 1, 1, 1, 1, 1, 1, 1, 1, 1,…
$ group   <fct> 0.1, 0.1, 0.1, 0.1, 0.1, 0.1, 0.1, 0.1, 0.1, 0.1, 0.1, 0.1, 0.…
$ id      <chr> "0", "0", "0", "0", "0", "0", "0", "0", "0", "0", "0", "0", "0…
$ BZNR    <int> 101, 101, 101, 101, 101, 101, 101, 101, 101, 101, 101, 101, 10…
$ KTNR    <int> 1, 1, 1, 1, 1, 1, 1, 1, 1, 1, 1, 1, 1, 1, 1, 1, 1, 1, 1, 1, 1,…
$ GRNR    <int> 4, 4, 4, 4, 4, 4, 4, 4, 4, 4, 4, 4, 4, 4, 4, 4, 4, 4, 4, 4, 4,…
$ AREA_HA <int> 11303, 11303, 11303, 11303, 11303, 11303, 11303, 11303, 11303,…
$ X_MIN   <int> 671862, 671862, 671862, 671862, 671862, 671862, 671862, 671862…
$ X_MAX   <int> 686462, 686462, 686462, 686462, 686462, 686462, 686462, 686462…
$ Y_MIN   <int> 229137, 229137, 229137, 229137, 229137, 229137, 229137, 229137…
$ Y_MAX   <int> 245396, 245396, 245396, 245396, 245396, 245396, 245396, 245396…
$ X_CNTR  <int> 678300, 678300, 678300, 678300, 678300, 678300, 678300, 678300…
$ Y_CNTR  <int> 235900, 235900, 235900, 235900, 235900, 235900, 235900, 235900…
$ Z_MIN   <int> 380, 380, 380, 380, 380, 380, 380, 380, 380, 380, 380, 380, 38…
$ Z_MAX   <int> 914, 914, 914, 914, 914, 914, 914, 914, 914, 914, 914, 914, 91…
$ Z_AVG   <int> 561, 561, 561, 561, 561, 561, 561, 561, 561, 561, 561, 561, 56…
$ Z_MED   <int> 557, 557, 557, 557, 557, 557, 557, 557, 557, 557, 557, 557, 55…
# The cantons are identified by the KTNR column
# Extract from this data the districts of two cantons (18 = Graubünden, 21 = Ticino)

two_cantons <- d %>% filter(KTNR  %in%  c(18, 21))

# And draw the map
maps2_(two_cantons)

This worked quite fine - but I was more interested in plotting by language region, so I did the following:

# add an aditional variable "region"
d %>% 
  mutate(region = case_when(KTNR == 21 ~ "Ticino",
                                 KTNR  %in% c(22, 23, 24, 25, 26) ~ "Romandie",
                                 TRUE ~ "Deutschschweiz")) -> d

# draw a ggplot 
ggplot(d, aes(x = long, y = lat, group = group)) +
  geom_polygon(aes(fill = factor(region)), color = "black") +
  scale_fill_manual(name = "Region",
                   values = c("Ticino" = "grey90",
                              "Romandie" = "#b2df8a",
                              "Deutschschweiz" = "#a6cee3")) +
  theme_void() +
  theme(legend.position = "bottom") +
  coord_equal()

Troubleshooting

What is the problem with this plot (aside from the ugly black color of the boundaries)? The boundaries correspond to district, not cantonal level (what I wanted). As the variable KTNR identifies the cantons, I did the following:

# draw a ggplot and changed to aes(....group = KTNR)
ggplot(d, aes(x = long, y = lat, group = KTNR)) +
  geom_polygon(aes(fill = factor(region)), color = "black") +
  scale_fill_manual(name = "Region",
                   values = c("Ticino" = "grey90",
                              "Romandie" = "#b2df8a",
                              "Deutschschweiz" = "#a6cee3")) +
  theme_void() +
  theme(legend.position = "bottom") +
  coord_equal()

…It got even worse…

I did not understand why at first. After a brief online exchange in the Rladies-Slack (sidenote: fantastic place to learn! 😎), I realized that my problem is with the data: aes(x = long, y = lat) in my dataframe correspond to district level not cantonal level. Unfortunately, the link on the website of the Federal Office of Statistics didn’t work either1, so what to do else?

Look at the data structure:

# a list containing 8 elements (dataframes)
# which each contain lon/lat on different levels
class(shp_df)
[1] "list"
# very long output, not shown here
#str(shp_df)

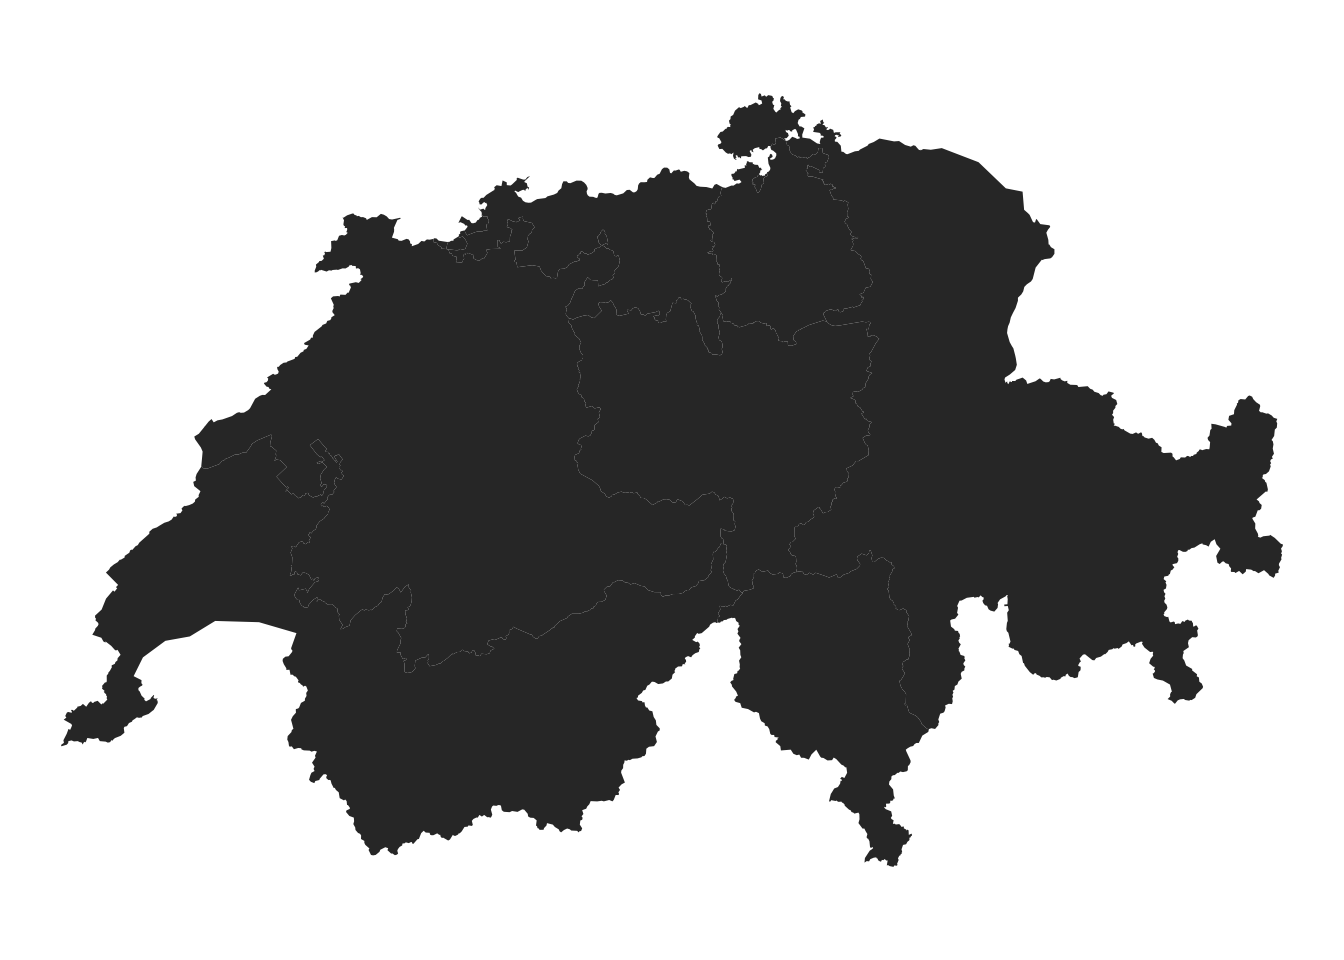
I now knew that I could use the plot from above and check each element of the list - either by hand (corresponding to seven times copy/paste) or with purrr::map()!

Solution

# create a function to map over each element of the list to
# identify if one is on cantonal-level
my_plot <- function(data){
  
  ggplot2::ggplot(data = data, ggplot2::aes(x = long, y = lat, group = group)) +
    ggplot2::geom_polygon() +
    ggplot2::theme_void() +
    coord_equal()
  
}

Then do the magic (1 simple line of code will give me 8 plots!):

# map it over the list
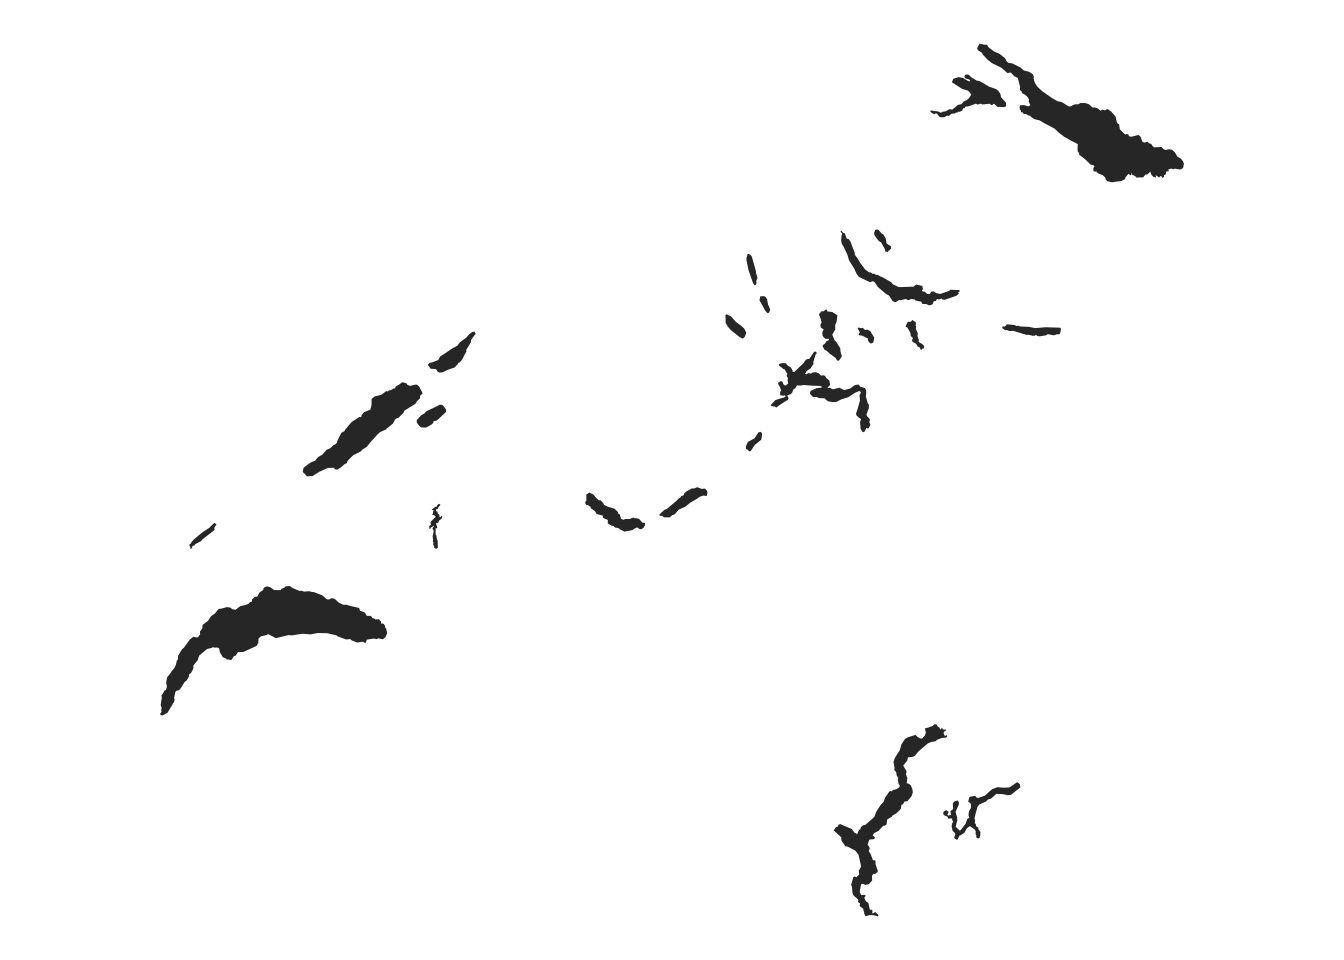
purrr::map(ggswissmaps::shp_df, ~my_plot(.x))
$g1b15


$g1g15_encl


$g1g15_li


$g1g15


$g1k15


$g1l15


$g1r15


$g1s15

From the plots above I now know which dataframe to use:

# solution: the second last element of the list is what I need
cant_level <- 
  ggswissmaps::shp_df$g1k15 %>% 
      mutate(region = case_when(KTNR == 21 ~ "Ticino",
                                KTNR  %in% c(22, 23, 24, 25, 26) ~ "Romandie",
                                TRUE ~ "Deutschschweiz"))

# draw the prettier graph
ggplot(cant_level, aes(x = long, y = lat, group = group)) +
  geom_polygon(aes(fill = factor(region))) +
  scale_fill_manual(name = "Region",
                   values = c("Ticino" = "grey90",
                              "Romandie" = "#b2df8a",
                              "Deutschschweiz" = "#a6cee3")) +
  theme_void() +
  theme(legend.position = "bottom") +
  coord_equal()

The output is what I wanted - altough we could improve it, as the lakes (which are left out in the district-level data) are not shown here…

Edit:

thanks to the ggswissmaps-maintainer gibo’s help, the maps look now much prettier:

ggplot(cant_level, aes(x = long, y = lat, group = group)) +
  geom_polygon(aes(fill = factor(region)), color = "white", size = 0.1) +
  scale_fill_manual(name = "Region",
                    values = c("Ticino" = "grey90",
                               "Romandie" = "#b2df8a",
                               "Deutschschweiz" = "#a6cee3")) +
  theme_void() +
  theme(legend.position = "bottom") +
  coord_equal() + # add a layer for the lakes
  geom_polygon(aes(x = long, y = lat, group = group), 
               data = shp_df[["g1s15"]], fill = NA, alpha = .5, color = "#0529B3", size = .1, lty = "solid")
Warning: Using `size` aesthetic for lines was deprecated in ggplot2 3.4.0.
ℹ Please use `linewidth` instead.

Footnotes

  1. In the meantime, the package maintainer provided me with the working links: https://www.bfs.admin.ch/bfs/fr/home/services/geostat/geodonnees-statistique-federale.html.↩︎